Banana River Water Quality: Difference between revisions
mNo edit summary |
|||
| Line 22: | Line 22: | ||
'''June - September''' | '''June - September''' | ||
* | *Algae thrive on the water's excess nutrients, creating massive blooms that block sunlight from the seagrass. | ||
*Water becomes pea soup green. | |||
*Decomposition of seagrass and algae consumes the water's oxygen and kills marine life. | *Decomposition of seagrass and algae consumes the water's oxygen and kills marine life. | ||
*Protein molecules decomposing algae, seagrass and marine life are attracted to both water and air, and when agitated by wind, create a smelly, dark foam on the lagoon's surface and shorelines. | *Protein molecules decomposing algae, seagrass and marine life are attracted to both water and air, and when agitated by wind, create a smelly, dark foam on the lagoon's surface and shorelines. | ||
'''October - December''' | '''October - December''' | ||
*Summer rain's end, cooler temperatures, and winds disperse the biological mass. Much of it settles to the bottom creating slimy, black muck. | *Summer rain's end, cooler temperatures, and winds disperse the biological mass. Much of it settles to the bottom creating a slimy, black muck. | ||
*Water is murky brown with very low clarity. | *Water is murky brown with very low clarity. | ||
*Oxygen and salinity levels improve. | *Oxygen and salinity slowly levels improve. | ||
'''January - March''' | '''January - March''' | ||
| Line 36: | Line 37: | ||
</div> | </div> | ||
<div class="irlcontentmiddle"> | <div class="irlcontentmiddle"> | ||
==Water Quality Standards== | ==Water Quality Standards== | ||
Florida Department of Environmental Protection (DEP) has determined that seagrass is the key indicator species representing the health of the lagoon's water. | Florida Department of Environmental Protection (DEP) has determined that seagrass is the key indicator species representing the health of the lagoon's water. | ||
Revision as of 08:02, January 7, 2021
Urbanized North Banana River suffers from excessive nutrient pollution caused by stormwater laden with lawn fertilizer, sewer seepage, and pet poop.
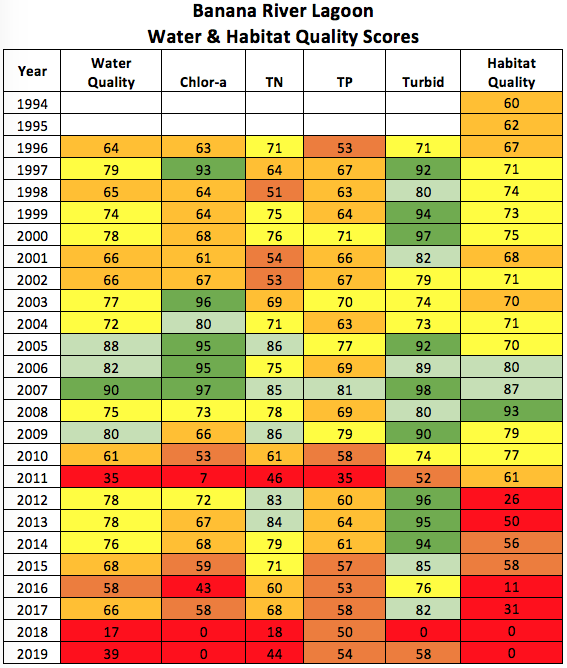
Banana River suffered from a major algae bloom in 2011, and brown tide in 2016.
Banana River Health Report
Marine Resources Council[1] performs an annual review of the Indian River Lagoon estuary's water data in order to publish the IRL Report Card. Rating several water quality factors on a scale of 0-100 resulted in the Banana River scoring less than 60 in December, 2020.[2] Banana River lagoon has been in a steady decline since 2015.
Water Quality Pattern
Like the entire IRL estuary, the Banana River's water quality varies with seasonal influences.
April - June
- Summer rains bring nutrient laden stormwater into the lagoon.
- Water clarity declines.
June - September
- Algae thrive on the water's excess nutrients, creating massive blooms that block sunlight from the seagrass.
- Water becomes pea soup green.
- Decomposition of seagrass and algae consumes the water's oxygen and kills marine life.
- Protein molecules decomposing algae, seagrass and marine life are attracted to both water and air, and when agitated by wind, create a smelly, dark foam on the lagoon's surface and shorelines.
October - December
- Summer rain's end, cooler temperatures, and winds disperse the biological mass. Much of it settles to the bottom creating a slimy, black muck.
- Water is murky brown with very low clarity.
- Oxygen and salinity slowly levels improve.
January - March
- Water clears up revealing a lifeless, barren desert below.
- Manatees move into the lagoon's warm water and graze on the remaining seagrass.
Water Quality Standards
Florida Department of Environmental Protection (DEP) has determined that seagrass is the key indicator species representing the health of the lagoon's water.
Seagrass provides habitat for shrimp, clam, and crab, in turn, these species feed fish that are using the seagrass flats as a nursery. Without seagrass there is no next generation of marine life in the lagoon.
Banana River Nutrient Load
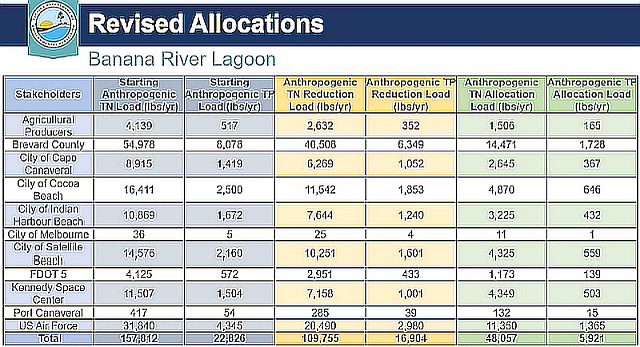
Florida's DEP has revised the nutrient load allocations for the 2021 Banana River Lagoon Basin Management Action Plan (BMAP) update.
Local municipalities will be asked to reduce Nitrogen (N) and Phosphorus (P) loads to a level that promotes seagrass growth in the lagoon. A healthy Banana River lagoon would require a 69.5% Nitrogen reduction and a 74% Phosphorus reduction by the year 2030.
- Nitrogen: Reduction Load lbs/yr 109,755 / Current Load lbs/yr 157,812 = 69.54% Nitrogen reduction required.
- Phosphorus: Reduction Load lbs/yr 22,826 / Current Load lbs/yr 16,904 = 74.05% Phosphorus reduction required.
See Also
Web Links
- Marine Resources Council IRL Health Update
- Banana River Lagoon Basin Management Action Plan Story Map
Documents
References
- ↑ Marine Resources Council, retrieved 2021-01-07
- ↑ Marine Resources Council Banana River Health Update 2020, retrieved 2021-01-07


