Banana River Water Quality

Banana River lagoon suffers from nutrient pollution caused by stormwater runoff, faulty sewer and septic systems, over-fertilized lawns, and excessive urban development over wetland areas. Human impact has greatly increased the residual levels of nitrogen and phosphorus in the water.
Banana River lagoon has no freshwater tributaries, no saltwater inlets, and a very slight southward gravity flow towards the Indian River. The result of little natural movement, lack of tributary inflow, and causeways that impede water flow, is a very long 144 day water refresh period. It could take almost 5 months for pollution introduced in North Merritt Island to flush out of the Banana River lagoon.
South of the Beachline Expressway (A1A), urbanized Banana River suffers from excessive nutrient pollution caused by storm and ground water laden with lawn fertilizer, sewer seepage, and pet droppings.
Banana River north of A1A is federal property managed by Merritt Island National Wildlife Refuge.
Water Quality Cycle
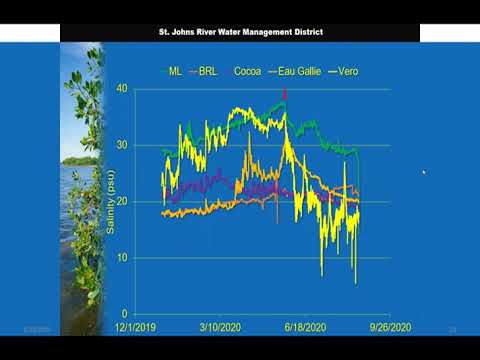
Like the entire Indian River Lagoon estuary, the Banana River's water quality varies with seasonal influences.
April - June
- Summer rains bring nutrient laden stormwater into the lagoon.
- Water clarity declines.
June - September
- Algae thrive on the water's excess nutrients, creating massive blooms that block sunlight from the seagrass.
- Water becomes pea soup green.
- Decomposition of seagrass and algae consumes the water's oxygen and kills marine life.
- Protein molecules decomposing algae, seagrass and marine life are attracted to both water and air, and when agitated by wind, create a smelly, dark foam on the lagoon's surface and shorelines.
October - December
- Summer rain's end, cooler temperatures, and winds disperse the biological mass. Much of it settles to the bottom creating a slimy, black muck.
- Water is murky brown with very low clarity.
- Oxygen and salinity slowly levels improve.
January - March
- Water clears up revealing a lifeless, barren desert below.
- Manatees move into the lagoon's warm water and graze on the remaining seagrass.
Banana River Health Report
Marine Resources Council[1] performs an annual review of the Indian River Lagoon estuary's water data in order to publish the IRL Report Card. Rating six water quality factors on a scale of 0-100 resulted in the Banana River scoring less than 60 in December, 2020.[2] Results of a major algae bloom in 2011, and brown tide in 2016 are obvious on the MRC score card, Banana River lagoon is failing rapidly.

Water Quality Standards

Florida Department of Environmental Protection (DEP) has determined that seagrass is the key indicator species representing the health of the lagoon's water. Seagrass provides habitat for shrimp, clam, and crab, who feed the fish that are using the seagrass as a nursery. Without seagrass there is no next generation of marine life in the lagoon.
Excerpt from DEP 2020 Banana River Lagoon Basin Management Action Plan Draft:
"Total Maximum Daily Loads (TMDL) are water quality restoration goals establishing the maximum amount of a pollutant that a waterbody can assimilate without causing exceedances of water quality standards. The IRL TMDLs focus on the water quality conditions necessary for seagrass regrowth at water depth limits where seagrass historically grew in the lagoon, based on a multiyear composite of seagrass coverage. The median depth limits of seagrass coverage in the IRL decreased over the years due to changes in water quality conditions resulting from anthropogenic influences.
As polluted runoff reaches the lagoon, it contributes to conditions that prevent the seagrass from growing in deeper water because of elevated light attenuation. The full restoration depth-limit target for seagrass was established for each segment based on a deep edge boundary delineating the composite of 7 years of historical seagrass data for the period from 1943 to 1999. The restoration targets were set at depths where the deep edge of the seagrass beds previously grew and created a maximum depth limit for seagrass distribution. The TMDL targets allowed for a 10 % departure (shoreward) from the full restoration target seagrass depth. The 10 % departure in target depths was selected to be consistent with the water quality criteria in Chapter 62-302, Florida Administrative Code (F.A.C.), which allows for up to a 10 % reduction in the photo compensation point.
To determine nutrient targets and reductions needed to improve lagoon water quality in each subbasin, regression relationships were used between 4 years of loading levels and the same years’ seagrass depth limit (the percent departure from the full restoration). Total nitrogen (TN) and total phosphorus (TP) targets were developed from the median concentrations observed where seagrass depth limits were within the 10 % departure (shoreward) from their full restoration levels. These targets should result in nutrient reductions that allow seagrass to grow almost to the depths previously seen in the area."[3]
Banana River Nutrient Load
Florida's DEP has revised the nutrient load allocations for the 2021 Banana River Lagoon Basin Management Action Plan (BMAP) update.
Local municipalities will be asked to reduce Nitrogen (N) and Phosphorus (P) loads to a level that promotes seagrass growth in the lagoon.
A healthy Banana River lagoon would require a 69.5% Nitrogen reduction and a 74% Phosphorus reduction by the year 2030.
- Nitrogen: Reduction Load lbs/yr 109,755 / Current Load lbs/yr 157,812 = 69.54% Nitrogen reduction required.
- Phosphorus: Reduction Load lbs/yr 16,904 / Current Load lbs/yr 22,826 = 74.05% Phosphorus reduction required.

Video
Select a video to play or visit the Indian River Lagoon News YouTube Channel - IRL Water Quality Video Playlist.
Indian River Lagoon 2020 Water Quality Assessment by Dr. Chuck Jacoby
MRC Banana River Lagoon Health Report by Dr. Leesa Souto
See Also
Web Links
- Marine Resources Council IRL Health Update
- Banana River Lagoon Basin Management Action Plan Story Map
Documents
References
- ↑ Marine Resources Council, retrieved 2021-01-07
- ↑ Marine Resources Council Banana River Health Update 2020, retrieved 2021-01-07
- ↑ DEP - Banana River Lagoon BMAP 2020 Draft (DOCX 137pp 5.6MB)