Link:Algal Bloom Dashboard: Difference between revisions
From Indian River Lagoon Project
No edit summary |
No edit summary |
||
| Line 10: | Line 10: | ||
|Poster=Admin | |Poster=Admin | ||
|Posted=20211229074106 | |Posted=20211229074106 | ||
|Extra=<iframe longdesc="https://fdep.maps.arcgis.com/apps/webappviewer/index.html?id=d62c3487e8de49f6b3a6559cdf059e14" marginheight="0" marginwidth="0" scrolling="yes" src="https://fdep.maps.arcgis.com/apps/webappviewer/index.html?id=d62c3487e8de49f6b3a6559cdf059e14" title="Florida Algal Bloom Sample Collection View" width="100%" height="1000" frameborder="1"></iframe> | |||
}} | }} | ||
Revision as of 08:24, December 29, 2021
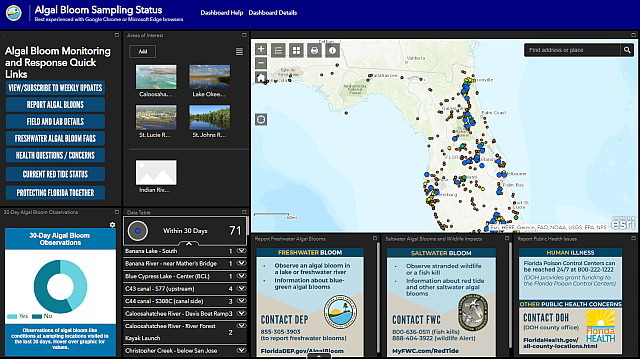
Florida Department of Environmental Protection (FDEP) Blue-Green Algal Bloom Dashboard displays the Florida algal bloom database on an interactive GIS map. The algal bloom dashboard includes the map, 30-Day observations, monitoring, reporting and links to FDEP algal bloom information. Zoom into your Florida location to view reported algae blooms.
Posted By: AdminPost Date: 2021-12-29

