Link:USGS National Water Dashboard: Difference between revisions
From Indian River Lagoon Project
mNo edit summary |
mNo edit summary |
||
| Line 5: | Line 5: | ||
|Text_Body=For a detailed view of the IRL Estuary, turn on the Hydrology-River Layer, and zoom into your favorite area of the IRL. | |Text_Body=For a detailed view of the IRL Estuary, turn on the Hydrology-River Layer, and zoom into your favorite area of the IRL. | ||
|Type=Map | |Type=Map | ||
|Topic=Water Quality | |Topic=Water Quality Links | ||
|Screenshot=Link screenshot usgs national water dashboard.jpg | |Screenshot=Link screenshot usgs national water dashboard.jpg | ||
|Poster=Admin | |Poster=Admin | ||
|Posted=20210519073938 | |Posted=20210519073938 | ||
}} | }} | ||
Revision as of 12:54, December 28, 2021
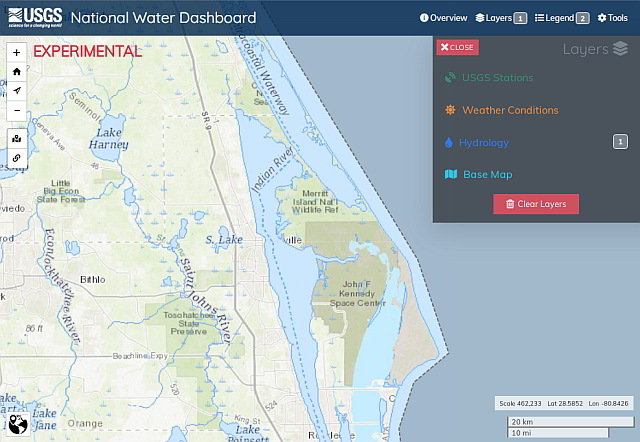
USGS National Water Dashboard
United States Water Dashboard map with data layers for all USGS monitoring stations. Best map of the Indian River Lagoon watershed showing detailed names of most all water bodies.
For a detailed view of the IRL Estuary, turn on the Hydrology-River Layer, and zoom into your favorite area of the IRL.
Posted By: AdminPost Date: 2021-05-19